
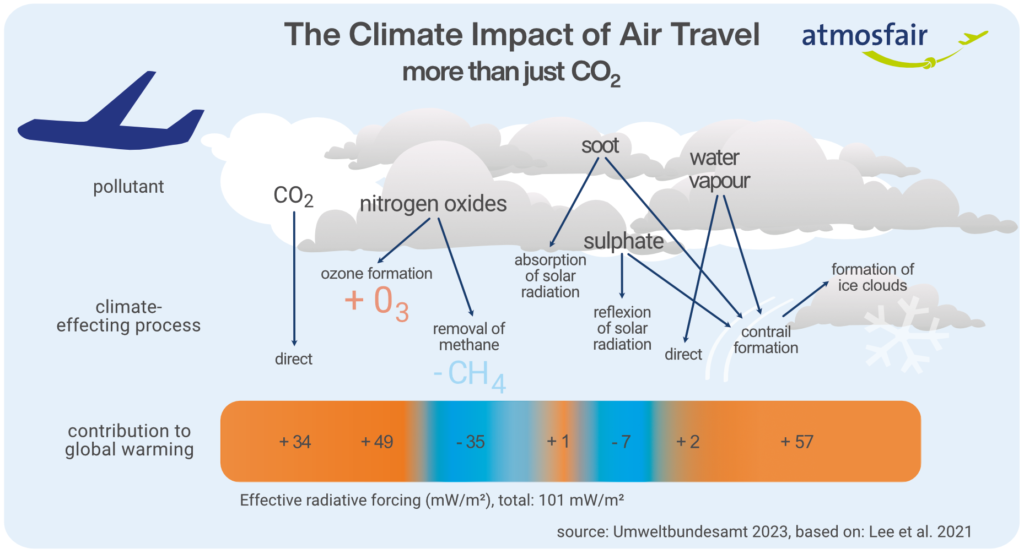
Flying has one major distinguishing feature compared with all other forms of transport: it does not take place on the ground, but usually at altitudes of between 9,000 and 13,000 metres, where the atmosphere is particularly sensitive. The exhaust gases emitted by an aeroplane at these altitudes have further effects on the climate in addition to CO₂. As well as the CO₂ emissions themselves, flying at these altitudes contributes to global warming through other so-called non-CO₂ effects.
The non-CO₂ effects of a flight generally include
- Contrails: Under certain atmospheric conditions, the hot, particle-rich exhaust gases from aircraft can lead to the formation of contrails. The atmospheric conditions required for contrail formation depend on the humidity and temperature of the surrounding air and, consequently, on the time of year. In addition to the lifespan and visual characteristics of contrails, their climate impact is also determined by the reflectivity of the surface below and the time of day. If the climate impact of contrails is averaged over a longer period and on a global scale, it is significantly greater than that of CO₂ emissions from air traffic. Read more here
- Nitrogen oxides (NOx): Nitrogen oxides affect local ozone concentrations (similar to the ozone smog that used to form in cities) and, in a further step, the concentration of methane in the atmosphere (methane removal). Both effects have opposing impacts on the climate (warming and cooling), although the warming effect clearly predominates. The net warming effect of nitrogen oxides from a single flight is, on the whole, weaker than that of CO₂.
- Other components: Water vapour causes only a slight warming effect due to its short residence time in the atmosphere. Soot causes warming, irrespective of its influence on contrail formation as mentioned above, whereas sulphate compounds have a cooling effect. Broadly speaking, the warming effects of these factors largely cancel each other out.
To simplify the assessment of these complex and varied effects, researchers have introduced so-called metrics that compare the climate impact of the effects listed above with that of pure CO₂ emissions.
These metrics differ, for example, in how they account for historical climate impacts or feedback loops within the climate system. Among other things, a time horizon is selected over which the climate impact is assessed. The choice of metric and associated time horizon also depends on the specific climate policy issue at hand. Within the framework of international climate policy and in accordance with the Kyoto Protocol, a time horizon of 100 years is usually adopted in order to adequately account for the long-lasting effects of gases such as CO₂ or nitrous oxide. The German Federal Environment Agency (Umweltbundesamt, UBA) also recommends the average temperature response (ATR100) metric for air transport, calculated over a period of 100 years (Niklaß et al. 2020).
Furthermore, the Intergovernmental Panel on Climate Change (IPCC) has developed the global warming potential (GWP) metric. It was not designed specifically for aviation and refers to time horizons of 20, 50 or 100 years, depending on whether short- or long-term climate impacts are to be considered. In 2021, Lee et al. also developed GWP*, which no longer compares the absolute effects of different pollutants, but rather their change over time. The question posed by GWP* is therefore: how much CO₂ would global aviation need to emit to make the same contribution to global warming as, for example, contrails did between 2000 and 2018?
Table 1 lists these metrics for the non-CO₂ effects described above. The reference standard is always CO₂, which is specified here as the “reference gas” and, for standardisation purposes, is assigned a warming potential of 1. Depending on the metric, contrails contribute to climate impact to a greater extent than CO₂ emissions. The impact of nitrogen oxides is usually lower than that of carbon dioxide. Water vapour, soot and sulphate compounds have a comparatively small and, in some cases, counteracting effect.
| CO₂ | Contrails | NOx | H₂O | Soot | SO₂ | Σ | Source | |
|---|---|---|---|---|---|---|---|---|
| Simple ATR100 | 1.00 | 1.00 | 1.2 | 0.2 | n/a | n/a | 3.4 | (Niklaß et al., 2021) |
| GWP*100 | 1.00 | 1.77 | 0.33 | 0.04 | 0.02 | −0.15 | 3.0 | (Lee et al., 2020) |
| GWP50 | 1.00 | 1.09 | 0.28 | 0.04 | 0.02 | −0.14 | 2.3 | (Lee et al., 2020) |
| GWP20 | 1.00 | 2.32 | 0.86 | 0.08 | 0.04 | −0.30 | 4.0 | (Lee et al., 2020) |
Table 1: Comparison of metrics for the climate impact of air travel
Result: A climate factor of 3 applied to pure CO₂
Overall, this leads to the conclusion that air traffic at high altitudes, when considered in total (CO₂ and non-CO₂), contributes three times as much to global warming as its CO₂ emissions alone. atmosfair therefore applies this “factor of 3” to all CO₂ emissions at high altitudes relative to pure CO₂ emissions, in order to account for the climate impact of non-CO₂ emissions.
Sources
Umweltbundesamt (UBA):
Dahlmann et al. (2023): Climate Impact of Aviation
Niklaß et al. (2020): Integration of Non-CO2 Effects of Aviation in the EU ETS and under CORSIA
Bopst et al. (2019): Umweltschonender Luftverkehr
 Share
Share