

Global passenger air travel continues to remain well short of the Paris climate targets. There is no sign of a reduction in emissions. CO₂ emissions from civil passenger aviation in 2025 exeeded levels of 2019, the record year before the start of the COVID-19 pandemic. Airlines even fall behind their own internationally agreed efficiency targets, according to the latest atmosfair Airline Index (AAI), published during the Antalya Climate Conference.
In 2025, airlines were only able to improve their average CO₂ efficiency by less than one per cent compared with the previous year. At the same time, the volume of passenger-kilometres rose by more than five per cent. As long as passenger numbers continue to grow faster than efficiency improves, it will not be possible to reduce CO₂ emissions – as required to meet the Paris Agreement climate targets. For international flights, the International Civil Aviation Organisation (ICAO) has agreed on an annual improvement in CO₂ efficiency of 2 per cent.
“The aviation industry is therefore failing to meet the target of at least partially decoupling the rise in its emissions from growing passenger traffic. To achieve this, old aircraft would need to be replaced with new and efficient models,” said atmosfair Managing Director Dr. Dietrich Brockhagen.
Necessary modernisation of aircraft fleets: Airbus and Boeing falling behind
A key reason for the slow progress in efficiency is the backlog in the production of more efficient aircraft models by the major manufacturers, Airbus and Boeing. In many cases, the limited number of new aircraft are being used to expand capacity rather than to replace older planes. Replacing older aircraft with more efficient models offers significant potential for reducing aviation’s climate impact. In theory, this could save around a quarter of kerosene consumption. This was the conclusion reached by a study published at the start of the year, to which atmosfair contributed data.
New aircraft such as the Boeing 737 MAX 8, the Boeing 787 and the Airbus A350 are currently setting the benchmark for fuel efficiency. As no airline’s fleet is dominated by these new models and none achieves maximum load factors, no airline features in the top AAI efficiency classes, A or B.
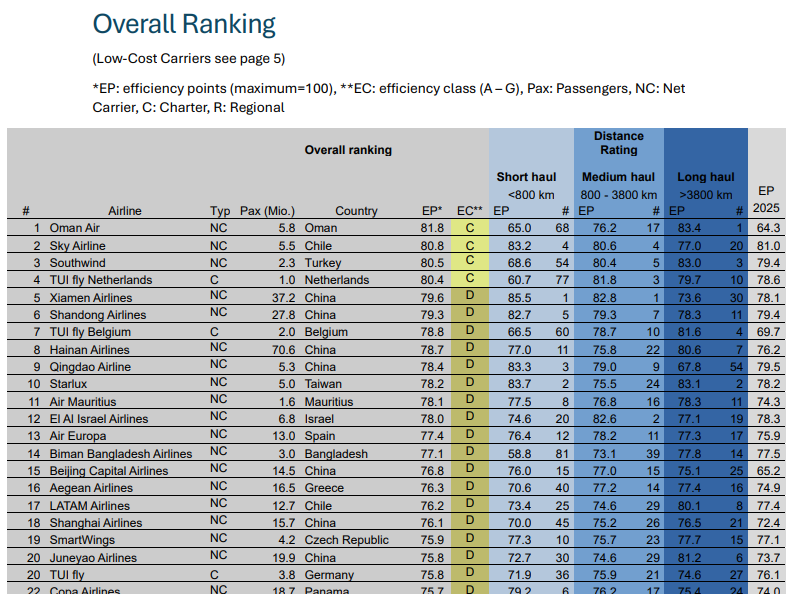
The top ten – modern fleets and high load factors
The top ten positions in the Airline Index are dominated by scheduled airlines from East Asia, which stand out either for their modern fleets or their high passenger load factors. Two charter airlines from TUIfly are also ranked highly, as they generally operate with high load factors. However, most airlines in the top ten have not shown a significant improvement in efficiency compared with the previous year.
Oman Air, however, improved its efficiency by 18 points compared with 2024, thereby taking first place with 82 out of 100 efficiency points. It has shifted its focus from connecting flights to direct services to and from Oman.
Among the larger scheduled airlines in European air transport, Air Europa (Spain), Aegean Airlines (Greece) and Smartwings (Czech Republic) achieved 75 to 85 efficiency points. SAS Scandinavian Airlines, airBaltic (Latvia), KLM-Royal Dutch Airlines (Netherlands), Neos (Italy) and ITA Airways (Italy) reached 70 to 75 efficiency points.
In the North American market, among the major scheduled airlines, Alaska Airlines (72 points), Porter Airlines (69 points) and United Airlines (68 points) perform best. American Airlines scores 64 points, whilst Delta Air Lines scores 61 points.
Low-cost carriers are assessed in a separate category within the AAI. On the one hand, these airlines often perform better than traditional scheduled airlines in terms of load factor and seating arrangements. However, they frequently benefit from subsidies which are converted into flight kilometers via artificially low ticket prices, creating CO₂ emissions that would otherwise not have been generated. Among the low-cost carriers, 9 Air (China), Wizz Air (Hungary/UK) and Akasa Air (India) achieve the highest scores.
Structure, data and methodology
The Atmosfair Airline Index (AAI) compares, on an individual basis, the kerosene consumption and, by extension, the greenhouse gas emissions and efficiency of more than 200 of the largest airlines worldwide. Overall, the AAI covers approximately 92 per cent of global air traffic. The current calculations are based on the latest available data from the global aviation industry for 2025.
In the AAI, each airline can be awarded between 0 and 100 CO₂ efficiency points, broken down into short-haul, medium-haul and long-haul flights. This allows every passenger to compare the airlines offering flights to their destination and to choose the one that produces the least CO₂ before travelling. This is particularly of interest to companies with a high volume of business travel, which, in the best-case scenario, can save on both CO₂ emissions and ticket costs by switching airlines.
The index is based on an airline’s CO₂ emissions per kilometre and passenger across all the routes it operates. The index calculates CO₂ emissions based on the aircraft type, the engines, the use of winglets (aerodynamic wing tips), passenger and cargo capacity, and the load factors on each individual flight. Data sources consist exclusively of international organisations such as ICAO or IATA, a range of specialised data services within the aviation industry, and computer models developed by aircraft engineers.
The differences between airlines can be significant. Fuel consumption per passenger per kilometre on the same route can be more than twice as high for one airline as for another. The best results are achieved by airlines that use modern aircraft suited to the route length, accommodate a large number of seats, and make good use of both passenger and cargo capacity.
The atmosfair Airline Index provides calculations of CO₂ emissions. However, these account for only part of the climate impact caused by air travel. The Airline Index does not take into account the additional climate impact caused by contrails, nitrogen oxides and other emissions.
For more information about the atmosfair Airline Index, visit this website.
 Share